

Technology Understanding
The team mapped the DTS concept, optical fiber sensing flow, Raman backscatter principle, and core product benefits.
India
2023
An industrial temperature monitoring system can be difficult to explain with static diagrams alone. The client needed an industrial product video that could make fiber optic temperature sensing, data flow, and high-risk industrial use cases clear for technical decision-makers.
Spark Vfx Studios created a 3D product video for TATUS, an industrial-grade Distributed Temperature Sensing system developed by Trisnota Technical Services Pvt. Ltd. The film used 3D animation and motion graphics, technical cutaways, and industrial environment visualization to explain how the monitoring technology works.
As part of Spark Vfx Studios work in 3D Product Animation and Industrial Demo Videos and Manufacturing and Industrial communication, the project turned optical sensing principles into an understandable industrial product narrative.
The central challenge was translating optical sensing and Raman reflectometry into visual storytelling that felt accurate, but not academic. The audience needed to understand how light travels through fiber, how backscatter relates to temperature, and how the system maps risk across large facilities.
The video also required believable industrial environments. Jails, refineries, power plants, transportation corridors, and high-temperature infrastructure all needed to feel grounded enough to demonstrate real-world use cases without distracting from the product mechanism.
The scientific layer and motion design layer had to work together. Data visualization, internal component views, optical fiber paths, and temperature mapping sequences needed to clarify the technology while keeping the film cinematic and sales-ready.
The objective was to help industrial clients and decision-makers understand the TATUS industrial temperature monitoring system and visualize its operational value through an engaging 3D product video.
Spark Vfx Studios structured the film around the sensing journey: light transmission, signal response, temperature interpretation, alert visualization, and industrial action. This gave the video a technical spine that stayed easy to follow.
Dynamic 3D cutaways were used to reveal internal components and data pathways. Optical fibers, light pulses, backscatter signals, and monitoring dashboards were visualized as connected layers so viewers could understand both the science and the operational benefit.
The industrial environment scenes placed TATUS into recognizable use cases such as power plants, petrochemical units, transportation sectors, and secure facilities. Motion graphics and temperature heat-mapping visuals helped turn invisible data into a readable safety and surveillance story.
The team mapped the DTS concept, optical fiber sensing flow, Raman backscatter principle, and core product benefits.
Power plants, petrochemical units, transport corridors, and secure facilities were planned as practical monitoring scenarios.
Internal components, optical fiber paths, light transmission, and data movement were visualized through layered 3D cutaways.
Temperature mapping, alerts, dashboard cues, and sensing zones were animated to make invisible data readable.
Final scenes were refined for technical clarity, cinematic rhythm, stakeholder presentations, and industrial sales use.
The completed product video helped position TATUS as an advanced industrial temperature monitoring system, making complex Distributed Temperature Sensing concepts more accessible for industry stakeholders.
The film supported the product positioning around reliability, precision, and Make in India technology by showing how fiber optic sensing can monitor large and difficult environments. Final campaign metrics, direct audience response, and client feedback details are still pending confirmation.
Spark Vfx Studios created an industrial product video for TATUS, an industrial-grade Distributed Temperature Sensing system. The film used 3D animation and motion graphics to explain fiber optic sensing, data flow, and industrial temperature monitoring clearly.
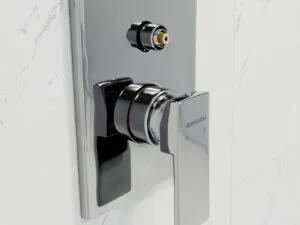
Spark Vfx Studios created four 3D bathware product explainer videos for Johnson Bathrooms, covering a diverter, wall-hung WC, basin mixer,
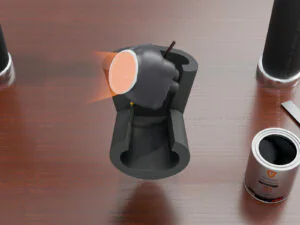
A high-impact industrial product video production project using 3D animation and CGI to transform HVAC engineering into compelling marketing content.
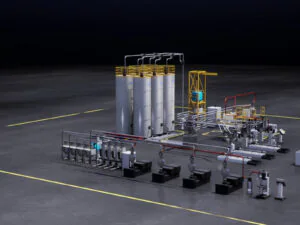
Spark VFX Studios produced a 3D industrial animation for a leading industrial technology company, visualizing a complete automated manufacturing workflow.

Spark VFX Studios developed a 3D product animation film for Greenply Industries Ltd., presenting Triguard Ply’s strength, termite resistance, and

DISCUSS NEW PROJECT OR JUST TO SAY HELLO GET IN TOUCH WITH US
Cookie preferences
We use necessary cookies to run this website. With your permission, we may also use analytics cookies to understand visitor behavior and improve our content.